Setting your pricing
Every figure your calculator produces comes from this page. The installation cost, the annual saving, the payback period, the monthly instalment: all of it is arithmetic on the numbers below, and none of it is hardcoded anywhere. The estimate is worth exactly what these figures are worth.
This is the page that matters most, and it is the one nobody else can fill in for you. Pricing is admin only; a rep sees the same page with the inputs disabled and a line saying so.
Start by replacing the examples
Section titled “Start by replacing the examples”A new account arrives carrying Solar Desk’s example figures, and says so in amber at the top of the page.
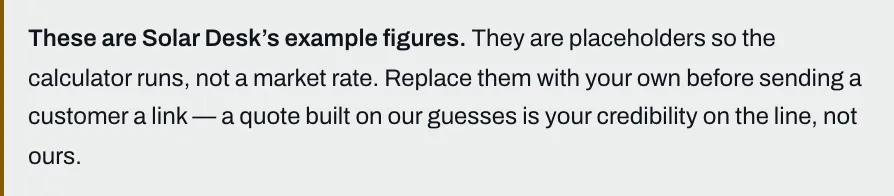
The warning disappears once you have changed your costs, and it is worth knowing exactly what that means. The check looks at three fields only: base installation, per kWp of system, and scaffolding. Change any one of them and the warning goes, whether or not the rest of the sheet is right. Treat it as a prompt, not a certificate.
Generation: what a system makes where you are
Section titled “Generation: what a system makes where you are”- Yearly generation per kWp, in kWh. Roughly 850 to 950 across the UK, higher in the south. This one figure sits underneath both the saving and the payback, so it is the fastest way to make an estimate optimistic by accident.
- Panel wattage you usually fit, in watts. The system size is worked out by multiplying the panel count by this, not by the wattage of the panel a customer picks in your catalogue. If you mostly fit 440W panels and this says 485W, every system on screen is a little larger than the one that goes on the roof. Keep the two close.
- kWp per m² of usable roof. How much capacity fits on a square metre once spacing is allowed for. This decides the roof maximum, which caps the panel slider on step 4 and produces the “your roof is the limit here, not your electricity use” message.
Tariffs: what electricity is worth
Section titled “Tariffs: what electricity is worth”Used when a customer does not give their own rates, which most do not.
- Electricity price, in pence per kWh. Every unit of solar a household uses is a unit it does not buy at this price, so this is where most of the saving comes from.
- Export payment, in pence per kWh. What they are paid for what they send back, and usually much lower. That gap between the two is exactly why the next group but one matters so much.
Your costs: what you charge
Section titled “Your costs: what you charge”Before any discount. These four are most of the installation cost a customer sees. The only other thing that goes into it is the cost of the battery they picked, which comes from your catalogue rather than from here.
- Base installation. Everything that does not scale with panel count: survey, DNO application, certification.
- Per kWp of system. The part that does scale.
- Scaffolding.
- Extra for an outdoor battery. Added only when a customer takes a battery and says it goes outside. It is one of the things you would otherwise have to ring and ask.
How much solar gets used at home
Section titled “How much solar gets used at home”The three most influential numbers on the page, and the least obvious.
Self-consumption is the share of what a system generates that replaces bought electricity instead of being exported. A unit used at home is worth your electricity price; a unit exported is worth the export payment. Moving this figure moves the annual saving more than anything else on the sheet.
- Without a battery.
- With a battery. This is what a battery actually buys the customer, and it is what makes the “add a battery” tick box on step 4 show a bigger saving.
- What you aim to cover when sizing. The share of a household’s yearly use you want the recommended system to cover. Raise it and the recommendation gets bigger, along with the cost.
All three are decimals between 0 and 1, not percentages: 0.65 means 65 per cent.
Finance
Section titled “Finance”These only reach a customer when Show finance options is switched on in Theme.
- Largest deposit you accept, again 0 to 1. It caps the deposit slider on the estimate.
- Representative APR, as a percentage. Worth knowing that this is an effective annual rate, so the monthly instalment is not the APR divided by twelve, and the figure a customer sees will sit a penny or two off a rough calculation. The instalment plan explains it from the customer’s side.
- Lender. Named in the representative example, and required as soon as you show finance.
Saving, and what happens to quotes you already sent
Section titled “Saving, and what happens to quotes you already sent”Save pricing confirms with “Saved. New quotes use these figures.”
The word “new” is doing real work there. Saving writes a new version of the sheet rather than editing the old one, and every estimate keeps a frozen copy of the figures it was built on. So a quote you sent last month still reproduces exactly as the customer received it, and a lead you open a year later still adds up. You can put your prices up on a Tuesday without rewriting anything you have already promised.
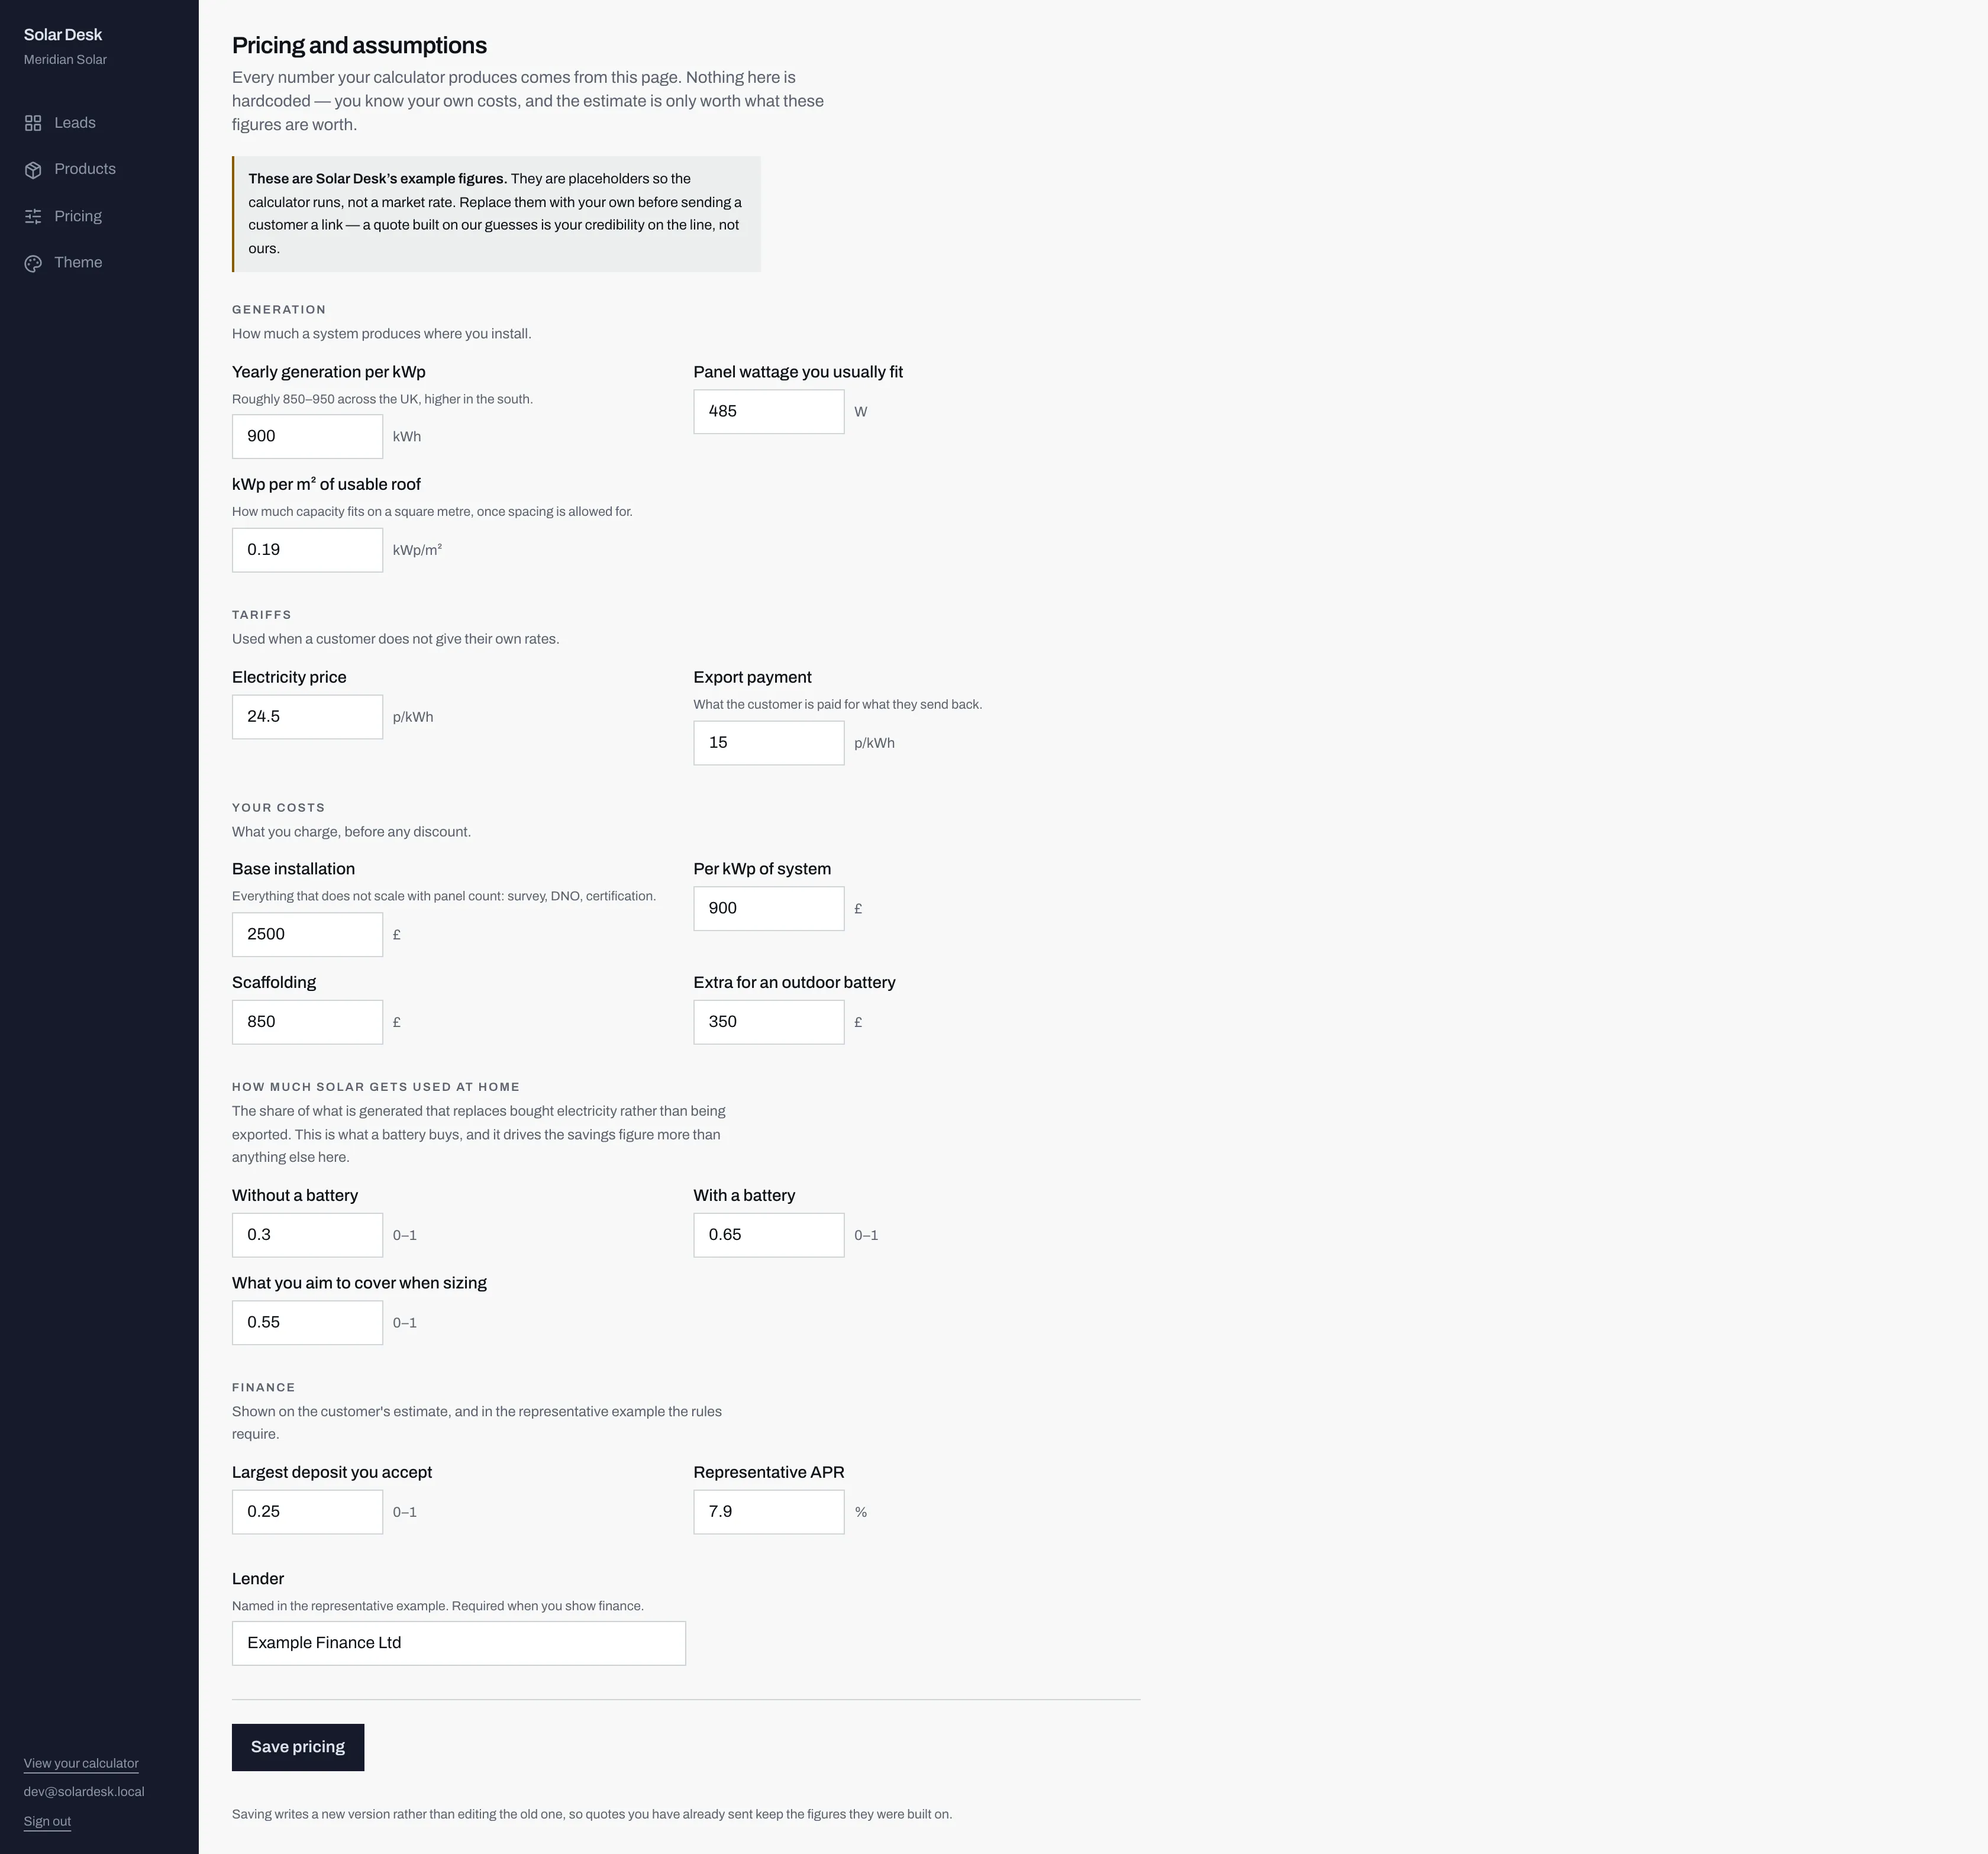
- Yearly generation per kWp. Everything downstream, the saving and the payback both, rests on this number.
- Base installation, one of the three fields the placeholder check looks at. The other two are per kWp of system and scaffolding.
- Self-consumption with a battery. It cannot be set lower than the figure without one, and the save refuses if it is.
- Save pricing writes a new version. The note underneath says why: quotes you have already sent keep the figures they were built on.
When you are done
Section titled “When you are done”Changing your costs clears one of the three go-live blockers. The other two are a panel in your catalogue and an address to receive new leads.
Then preview the calculator and read the four figures on step 5 as a customer would. That is the only real test of this page.